Qwen3.6-35B on one 12 GB GPU: 48.7% best on all 300 SWE-bench Lite instances
Contents
Canonical URL: https://synenergy.ai/research/swebench-lite-300-local-35b (cite it at that address).
What we measured
We ran a coding agent over SWE-bench Lite, all 300 instances — the entire split, not a
sample. The instance list is frozen as the manifest swebench_lite_300.txt, sha256
6b9850decb64f71aaed19d394195eb254b666a4abe7f113365195b3e4de2b450, published with the
receipts so anyone can confirm the task set was not curated after the fact.
The model is a local Qwen3.6-35B-A3B, Q4_K_XL, served by llama-server on a single
RTX 4070 SUPER with 12 GB of VRAM. Nothing was sent to a hosted API. The commodity hardware
is part of the result: this is one desktop GPU, not a cluster. The agent is the open-source
mini-swe-agent (2.4.6) with a single bash tool, plus the additions each arm below describes.
Two numbers, together, because reporting either alone would be a choice we do not want to make:
- Baseline (arm A): 135 / 300 = 45.0%.
- Best intervention (arm B): 146 / 300 = 48.7%.
The denominator is 300 in every number in this post. It was fixed in writing before the runs, and it does not move: "The denominator is 300 whatever happens. A crashed, skipped, or unstarted instance counts as NOT resolved." We never report resolved-over-evaluated. Arms lost different numbers of instances to grading infrastructure, and a per-arm denominator would quietly reward whichever arm lost fewer.
A note on how this post was assembled, because it is part of what we are claiming. Five of
the numbers we originally intended to publish did not survive being checked against our own
frozen files — and they are five instances of one mechanism: a real measurement quoted into
a context it did not come from. One — ~7,166 completion tokens per task — was computed over the wrong
population: it is close to the mean over the 225 Submitted tasks, not over all 300, where
the mean is 11,107 and the median 7,092. One — the 30-instance memorisation control — was
computed over a subset that turned out not to exist: no script, no seed and no id list
survive, and it is replaced by all 88 scorable unresolved-but-patched instances. One —
and our record no longer says which of two figures it was, a pair of cut VRAM readings, which
are not restated here because nothing in the evidence tree produces them, or the timing
figures attributed to a 285-instance subset that does not exist — could not be traced to the measurement it was attributed to. One — the memorisation
mean, 0.351 — was not reproducible from the evidence and moved to 0.3484 when it was
recomputed end to end. And one — the concurrency staircase, 1.74x total scaling — was a
warm-up probe captioned as sustained throughput; measured over the real workload the scaling
is 1.15x to 1.31x. In none of the five was a number invented. That is the
point, and it is the more useful half of this post: the failure mode that survives careful
people is not fabrication, it is a correct number carried across a boundary it does not hold
across. Each was corrected or cut before publication; the disposition of each in full is in
UNVERIFIED.md. A sixth figure was withdrawn as well — a step-budget claim, and it is
the same mechanism a sixth time, not a defect of a different kind — set out under "Model
calls per task" below. A further figure — an "evaluated" column reading 229 for arm A,
which is in fact arm D-1's submitted count — failed the same way, but it was caught against
the frozen files before it ever reached this post, so it is not counted among the numbers
this post had to walk back. That is
what the receipts are for — a number you cannot walk back to a file is not a result, and a
number you can walk back still has to be walked back to the right file.
One thing needs saying before anyone reaches for a comparison: 45.0% here is on Lite. Most figures published in the field are on SWE-bench Verified, a different split with different instances, and are not comparable. What Lite does allow is set out in the next section, with its limits.
How this compares
The comparison a reader will reach for is the public SWE-bench Lite board. Here is a selection from it, with the conditions that stop most of it being like-for-like.
| System | Model | Open weights | Size · hardware | Attempts | Lite % | Source |
|---|---|---|---|---|---|---|
| ExpeRepair v1.0 | Claude 4 Sonnet + o3-mini/o4-mini | no | not disclosed | 2+ | 60.33 | board |
| Refact.ai Agent | Claude 3.7 Sonnet + o4-mini | no | not disclosed | 1 | 60.00 | board |
| SWE-agent | Claude 4 Sonnet | no | not disclosed | 1 | 56.67 | board |
| EntroPO + R2E | Qwen3-Coder-30B-A3B, fine-tuned | base only | 30.5B, 3.3B active | best-of-16 | 49.67 | board |
| This post, arm B | Qwen3.6-35B-A3B, Q4_K_XL | yes | 35B, 3B active · one RTX 4070 SUPER, 12 GB | 1 | 48.7 | this post |
| ai-muninn | Qwen3.6-35B-A3B, FP8 | yes | 35B, 3B active · DGX Spark, 128 GB | 1 | 48.33 | blog, not on board |
| SWE-agent | Claude 3.7 Sonnet | no | not disclosed | 1 | 48.00 | board |
| This post, arm A | Qwen3.6-35B-A3B, Q4_K_XL | yes | 35B, 3B active · one RTX 4070 SUPER, 12 GB | 1 | 45.0 | this post |
| EntroPO + R2E | Qwen3-Coder-30B-A3B, fine-tuned | base only | 30.5B, 3.3B active | 1 | 45.00 | board |
| CodeFuse-CGM | CGM, Qwen2.5-72B based | yes | 72B dense | 2+ | 44.00 | board |
| OpenHands CodeAct 2.1 | Claude 3.5 Sonnet | no | not disclosed | untagged | 41.67 | board |
| KGCompass | DeepSeek-V3 | yes | 671B, 37B active | 2+ | 36.67 | board |
| SWE-agent | SWE-agent-LM-32B | yes | 32B dense | 1 | 30.7 | paper, not on board |
| Moatless Tools | DeepSeek-V3 | yes | 671B, 37B active | untagged | 30.67 | board |
| Moatless + verifier | SWE-Gym-32B | yes | 32B dense | best-of-k | 26.0 | paper, not on board |
| SWE-Fixer | Qwen2.5 7B + 72B, fine-tuned | yes | 7B + 72B dense | 1 | 24.67 | board |
† "Board" is the official SWE-bench Lite leaderboard; "untagged" means the board records no attempt count. EntroPO's own README gives 134/300 and 148/300 for its two entries, one instance below each board figure; the board figures are shown. ai-muninn.com, 2026-04-20, mini-swe-agent with three added rules, one run. Papers: SWE-smith (arXiv 2504.21798), SWE-Gym (arXiv 2412.21139).
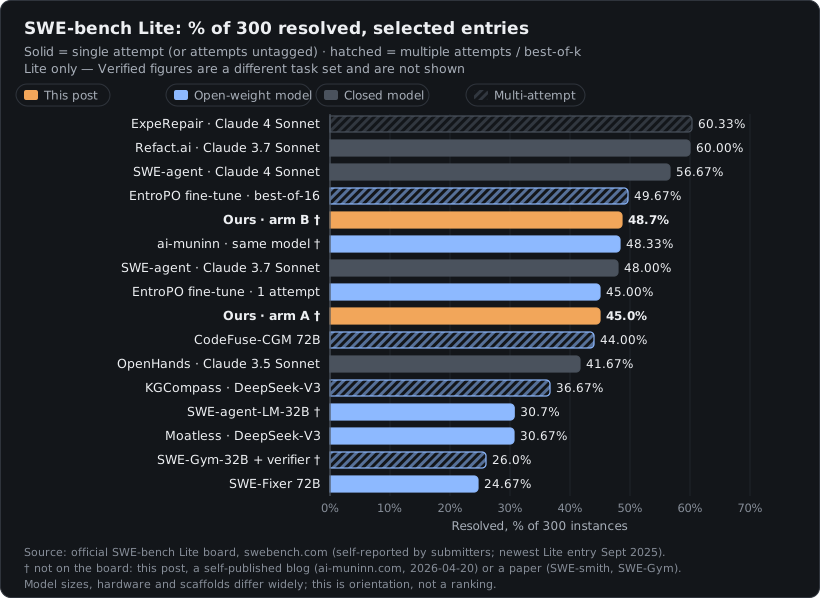
Four things limit what this table can say.
The board is self-reported and has stopped moving. Entries are submitted by their authors, the newest Lite entry dates from September 2025, and frontier labs now report SWE-bench Verified only. This is a 2024–2025 snapshot, not the current state of the art.
Attempts are not interchangeable. A multi-attempt or best-of-k entry chooses among several patches per task; ours is one attempt per instance. EntroPO shows the size of that gap on a 3B-active model: 45.00 with one attempt, 49.67 with sixteen.
Open-weight models here differ in size by two orders of magnitude, from 7B dense to 671B with 37B active, mostly on undisclosed hardware.
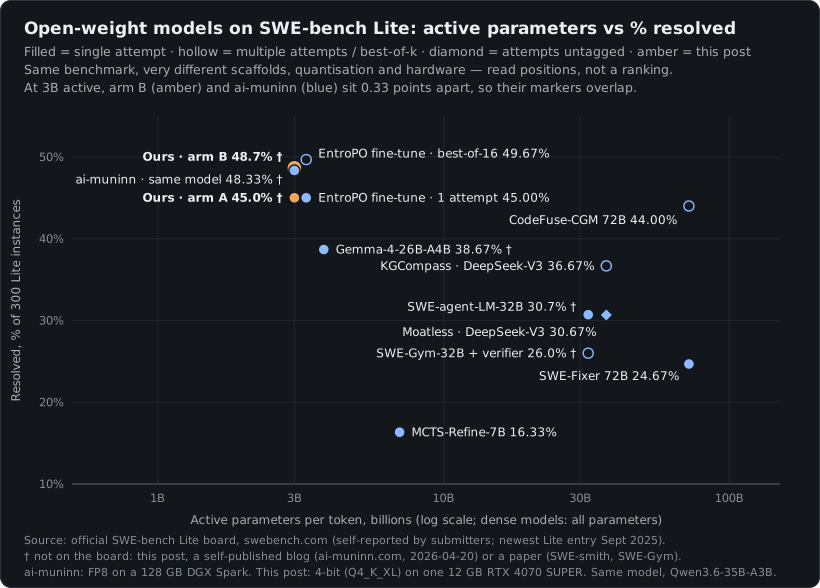
Verified is not on this axis. Qwen's model card reports 73.4% on Verified for this same model with Qwen's own scaffold; it is a different instance set and we do not plot it. Vendor Verified figures also run well above independent runs of the same model — GLM-4.5 64.2 against 54.2, Devstral 2 72.2 against 53.8, gpt-oss-120b 62.4 (on a 477-instance subset) against 26.0 — gaps of 10 to 36 points.
What survives those limits is narrow. The closest comparison is the same model. An independent run of Qwen3.6-35B-A3B, at FP8 on a 128 GB DGX Spark, resolved 145 of 300 (48.33%) — one run, self-published, not on the board. Arm B's 146 is level with it: one instance is inside run-to-run noise, which we did not measure. Arm A's 135 differs from that run in quantisation (4-bit against 8-bit), hardware (one 12 GB consumer GPU against a 128 GB workstation) and scaffold all at once, so the ten-instance gap cannot be assigned to any one of them. Both runs use the same open agent, mini-swe-agent: theirs adds three rules (a strict command format, an edit tool that replaces exactly one match, and a prompt to submit by step 60 of 100); ours adds the loop handling described below. None of their three rules is in any of our arms.
The pre-registered bar
The pre-registration named one primary metric, and named it in full: "resolved count out of 300, on the identical grading path as arm A." Both halves of that clause are conditions we set ourselves before any arm ran — the denominator, and the grading path. Arm D breaks the second half, as the block under the table sets out.
The pre-registration for arm B, written before that run started, predicted in advance that arm B would resolve more than arm A's 135/300 (45.0%), and committed: "A result at or below 135 is a real outcome and gets reported as such."
So 135 was the bar for arm B. Arm B came in at 146, clearing it. That outcome — 146 — then became the bar the later arms had to beat. Arm C and arm D did not beat it.
We also pre-committed to an arithmetic elimination rule: an arm is dead as soon as its resolved count plus its still-ungraded instances cannot reach the standing best, regardless of how the remainder might have gone.
The table
| Arm | Intervention | Resolved / 300 | % |
|---|---|---|---|
| A | baseline | 135 | 45.0% |
| B | resampling when a command repeats | 146 | 48.7% |
| C | context intervention on block | 132 | 44.0% |
| D-1 † | C with delayed onset (setting 1) | 128 | 42.7% |
| D-2 † | C with delayed onset (setting 2) | 120 | 40.0% |
† lower bound, not like-for-like — see below.
Two things you must read with this table, not after it.
1. The arms differ in more than the intervention. Arm A ran one worker; arm B ran
four. The pre-registration declares this in advance rather than discovering it later:
"Arm B runs 4 workers against one llama-server with 4 slots; arm A ran 1 worker." Concurrency
is a declared confound in the A-vs-B comparison, and the +11-instance gap has to be read with
that in mind. What concurrency actually buys on this hardware — and a correction to a
throughput figure in an earlier internal draft — is in "Serving throughput, and a
correction to an earlier draft" below, with the derivation in receipt_staircase.md.
A vs B stays the headline comparison because it is the pre-registered one: arm A is the control and arm B is the intervention. B vs C is a comparison between two interventions with no control in it, so it cannot say anything about improving on the baseline. It says one thing only, and we state it at exactly that strength: resampling resolved 14 more instances than the context intervention did (146 vs 132).
Two independent pieces of evidence say the worker count is not what bought the gain.
(i) A one-worker control run. We re-ran a fixed 35-instance subset with one worker,
against a pre-registered instance list whose checksum was recorded at the start of the run
(0089b36d…, 35 ids, run COMPLETE at 35/35). On that identical subset the one-worker
control resolved 8 and the four-worker arm B also resolved 8 — the same count, with
6 of the 8 being the same instances and each run resolving two the other did not. The two
the control resolved and arm B did not are matplotlib__matplotlib-25079 and
matplotlib__matplotlib-25311; the two arm B resolved and the control did not are
mwaskom__seaborn-3407 and sympy__sympy-21379. The six shared instances are
astropy__astropy-12907, django__django-14580, scikit-learn__scikit-learn-11281,
scikit-learn__scikit-learn-15512, sympy__sympy-18532 and sympy__sympy-23262 — recovered
by intersecting the two runs' grading records over the 35 ids, and listed in the receipts, so
all eight on each side are checkable rather than taken on our word. On this subset, running
at four workers bought nothing.
(ii) Four workers did not help arm C. Arm C also ran at four workers and landed below single-worker arm A: 132 vs 135. Whatever four workers does, it plainly does not hand out resolved instances by itself.
How the 35 were selected, and why one number here proves nothing. The subset is documented, and the documentation disqualifies part of it: the instance list is arm A's loop-locked failures — the 35 tasks where the baseline got stuck repeating itself. Arm A therefore resolved 0 of these 35 by construction, not by measurement, and we do not report that 0 as a result. What survives the selection is the comparison the selection does not touch: the one-worker control and the four-worker arm B ran the identical 35 instances, so their 8-vs-8 is like-for-like regardless of how the 35 were chosen.
But the selection still bounds what that 8-vs-8 can be generalised to, and the bound is tighter than "small subset" suggests. These 35 are not a random draw from the benchmark; they are the tasks on which the baseline loop-locked — precisely the failure mode arm B's intervention was built to attack, and precisely the population where an effect of the intervention should be largest and an effect of worker count need not be. A result showing that worker count bought nothing here does not transfer to the other 265 instances, where the task mix is different and no such selection was applied. We did not run a one-worker control on a random subset, and that is the control this argument really wants. 35 of 300 is a small subset: it narrows the concurrency confound on one non-random slice of the benchmark, it does not eliminate it, it does not extend to the split as a whole, and we are not claiming either.
The pre-registration also set a tripwire for concurrency: if any arm-B task exits on the wall cap, concurrency has become a confound and every such task must be listed. It did fire. Five arm-B tasks exited on the 4500 s wall cap:
django__django-11019, django__django-13710, matplotlib__matplotlib-25311,
pytest-dev__pytest-11148, sympy__sympy-19254.
Arm A had zero. Arm C had three — django__django-11019,
pytest-dev__pytest-9359, pytest-dev__pytest-11148 — and each arm-D setting had two:
at D-1 django__django-11019 and django__django-15202, at D-2 pytest-dev__pytest-11148 and
sympy__sympy-20049. The pre-registered tripwire covered arm B only, so the arm-C and arm-D
ids were not listed when the tripwire was written; they were recovered afterwards from the
same per-run field that yields arm B's five, and all ten are now listed in the receipts and
checkable there. The
prediction that the wall cap would not be reached was wrong, and we are recording it as wrong
rather than dropping the check. Note the direction it points: the wall cap fired 5 times in
arm B, 3 in arm C and 2 in each arm-D setting, all four-worker arms, and 0 times in
single-worker arm A. On this evidence concurrency cost tasks rather than inflating the
score — if anything it worked against arm B. That reading is a direction, not a magnitude: 10
capped tasks across four arms is too few to put a size on, and the arms differ in their
intervention as well as their worker count, so the cap counts cannot be attributed to
concurrency alone.
2. Arm D's grading failed, and the failure is not one thing. Arms A, B and C were graded
one instance per run and were graded on all 300, by our own per-instance grader;
arm D was graded by different software — the stock SWE-bench bulk run_evaluation
harness — so the arms were not put through one identical grading path — which is precisely the condition
the pre-registered primary metric names, "on the identical grading path as arm A", written
down before the runs and not invented afterwards to discount an inconvenient result. Graded in bulk,
arm D lost 22 instances at D-1 and 24 at D-2, from two distinct causes. The larger part is
environment images that will not build on our machine: three SWE-bench environment images
— sweb.env.x86_64.7037e8c4…, sweb.env.x86_64.31244378… and sweb.env.x86_64.efa6065e…,
all matplotlib bases — each abort in conda's Solving environment with exit 134, and every
instance depending on them errors out with "Environment image not found" (16 instances at D-1,
18 at D-2). The remaining six at each setting were lost to a different failure entirely:
their per-instance evaluation image would not build because the repository's own install step
fails — no such option: --no-use-pep517 for the four (D-1) and three (D-2) scikit-learn
instances, a build backend missing the PEP 660 build_editable hook for the two (D-1) and
three (D-2) pylint ones. Arm D-1 completed grading on 207 of 300 and D-2 on 210 of 300; the
rest errored. The lost instances are not a random sample — they fall in three repositories,
matplotlib (16 at D-1, 18 at D-2), scikit-learn (4 and 3) and pylint (2 and 3) — so the lower
bound is biased by repository and not merely thinned. The two faults compound and cannot be
separated: the grader change is the one we can say least about, because we have not
established that the stock bulk harness and our own per-instance grader agree on the instances
they both could grade, so there is no measured basis for treating arm D's 207 or 210 graded
results as comparable to A, B and C's 300 even after setting the missing instances aside. The
lost instances are named: the full id lists for both settings, with the cause against
each, are in the receipts (arm_results.md), recovered from the evaluator's own error
records. Arm D's numbers are therefore a lower bound and are not like-for-like with A, B and
C. This is a defect in our measurement, not a property of arm D, and the honest summary is
that arm D's row belongs in the table as a failed arm, and its exact numbers should not be
quoted as measurements of anything. We state it next to the table, not in a footnote,
because a number whose weaknesses are buried is a marketing number.
How to read this post. The table above is the result, and the two things that qualify the comparison — the arms differ in worker count as well as in intervention, and arm D's grading failed — are the two blocks above. What follows, in order: the negative control, arm D's pre-registered failure, the secondary measures, the memorisation check and its strongest single suspect, where the losses actually are, the timing anatomy, and last a section on serving throughput that corrects a figure from an earlier internal draft of this post. Each section states its own limits in full, next to the thing they qualify; the receipts carry the derivations.
Negative control, arm A: three negative-control batches, five no-op evaluations across
four instances, all scoring zero. The four instances are django__django-17087,
sympy__sympy-20212, astropy__astropy-14182 and astropy__astropy-14995. A run that should
resolve nothing resolved nothing. (The "3" is a count of batches, not of instances, and we say
so because it would otherwise read as a sample size.) Each grading directory carries its own
negative-control triple over a different instance set, so this figure belongs to arm A and to
no other arm.
At four instances this control is weak, and naming them is what makes that visible. It can catch a grossly permissive grader — one that credits resolutions for environmental or bookkeeping reasons — and it did not fire. It has no power to bound a low false-positive rate, four instances out of 300 is not a sample from which anything about the other 296 follows, two of the four come from the same repository, and we ran no negative control at all for arms B, C and D. The correct reading is that the grading path passed a smoke test, not that it was validated.
The failure
Arm D failed its pre-registered condition. The later-onset setting was worse, not better.
The elimination was arithmetic, not judgement. At setting 2 (D-2): 120 resolved plus 24 never successfully graded is a ceiling of 144, below 146 — dead outright. At setting 1 (D-1) the arm stayed formally open (128 plus 22 ungraded = a ceiling of 150), but reaching 146 would have required an 86% resolve rate on the missing subset against 62% observed elsewhere. We closed the ladder there rather than spend another week chasing a result we had already pre-committed to calling a failure.
Two of the three intervention families we tried made things worse. One helped. We are reporting all of them.
One re-grading pass, and what it was
The pre-registration voids the comparison if "any instance is re-run individually after its first attempt". That rule was not broken, and we checked it rather than assuming it.
After arm D's bulk grading errored — at D-1 on 16 environment-image instances and on 7 whose
per-instance evaluation image failed instead (the six lost to the repository's own install
step, plus astropy__astropy-14995), 23 in all; at D-2 on 24 — we ran a second pass over
exactly those 23 (D-1) and 24 (D-2) instances. That pass
re-submitted the already-produced
patches, byte-for-byte identical to the ones in the original prediction files, to the
evaluator. The agent was not re-run; no new patch was generated. The second pass recovered
exactly one instance for D-1 — astropy__astropy-14995, whose evaluation image built on
the second attempt — and zero for D-2; the other 22 at D-1 and all 24 at D-2 errored again
for the same reasons as before. So 23 is the D-1 error count before the retry and 22 the
count after, and it is the 22 that "lost" means in the table's lower bound. Arm D-1's 128
is likewise 127 from the first grading pass plus that one recovered instance, on 206 + 1 = 207
graded.
Re-grading an existing prediction is not re-running an instance, so the comparison stands. It is still a deviation from the "no re-grading" posture we would prefer, and it is on the record here rather than folded in silently.
The secondary measures
The pre-registration required three measures to be reported alongside the resolved count and "not substituted for it". All three, per arm:
Exit-status mix (how the agent's run ended, before grading):
| Arm | Submitted | LoopLocked | LimitsExceeded | Wall cap | Empty patch |
|---|---|---|---|---|---|
| A | 225 | 35 | 40 | 0 | 1 |
| B | 244 | 4 | 47 | 5 | 0 |
| C | 212 | 58 | 27 | 3 | 0 |
| D-1 | 229 | 26 | 43 | 2 | 0 |
| D-2 | 237 | 14 | 47 | 2 | 0 |
The intervention did what it was aimed at: arm A's 35 loop-locked tasks fall to 4 in arm B.
They do not all become solutions — LimitsExceeded rises from 40 to 47 — but the specific
failure the intervention targeted largely disappears.
Model calls per task, resolved vs. not resolved:
| Arm | Resolved median | Resolved p95 | Not-resolved median | Not-resolved p95 |
|---|---|---|---|---|
| A | 35 | 86 | 59 | 120 |
| B | 37 | 95 | 71 | 150 |
| C | 39 | 77 | 52 | 150 |
| D-1 | 36 | 104 | 56 | 150 |
| D-2 | 36 | 94 | 65 | 150 |
A withdrawal belongs here first. An earlier draft of this post described the same quantity with a different set of figures: a median of 36 model calls, a p99 of 113, a maximum of 122, and a figure of 137 described as sitting "at the cap". All four are withdrawn, and the reason is the same mechanism as the five above rather than a new one. All four do recompute from arm A's own trajectories — but the earlier figures measured a different per-task quantity from the step count the cap applies to; recomputed from the step count they read 35 / 108 / 110 / 120. So 137 is impossible only as a step count, and it never was a step count; it is a real measurement of one quantity quoted as another. The p95 table here replaces those figures and is recomputed from the step count in the trajectory files.
This is the measurement that refutes "just raise the step budget". In every arm, tasks that resolve do so at a median in the mid-30s of model calls, while the tasks that fail sit at or against the ceiling — the not-resolved p95 is exactly the configured limit (120 for arm A, 150 for the rest). Tasks that were going to succeed had succeeded far below the cap. The ones at the cap were not almost-finished; they were stuck. Raising the ceiling from 120 to 150 between arm A and arm B did not move the resolved-task distribution at all.
The memorisation metric is reported in full below. It was computed on arm A's resolved set; we did not recompute it per arm, so a claim that arm B's gain is not increased copying is not supported by a per-arm measurement, and we are not making it.
The memorisation check
A 45% figure on a public benchmark invites the obvious question: did the model memorise the fixes? We measured added-line recall of each accepted patch against the gold patch, on arm A.
Two disclosures come first, because they are the honest part of this section.
The metric was re-derived, not recovered. No computation script and no stored output from
the original pass survive. We recomputed it from the frozen prediction files and the cached
gold patches, and we are publishing the re-derivation as a runnable script together with its
per-instance output: memorisation/added_line_recall.py and
memorisation/armA_added_line_recall_per_instance.csv, one row for each of the 224
instances that produced a patch. That script and that CSV are the authority for this
metric — every figure below is recomputable from them, and where this text and the CSV
disagree, the CSV wins.
One figure moved in the process, and say the whole of what that means. Our own earlier
record gave a mean of 0.351. That figure is not reproducible from our evidence, and we
publish 0.3484. Re-running end to end also exposed that our own first re-derivation had
mixed two variants of the definition — de-duplicated gold lines for the recall
denominator, raw gold lines for the count of one-line gold patches; settling on the
non-de-duplicated variant throughout reproduces the 32 and the 22 below exactly and gives
0.3484. The mean is itself one of the five numbers of ours that failed contact with the
evidence, and the mixed definition is why it failed: 0.351 could not be reproduced, and
our own first re-derivation of it moved to 0.3479 before the definition was settled. This is a replacement, not a correction: we are not publishing a
correction to a figure we can still see the working for, we are publishing a replacement for a
figure whose working no longer exists. Nothing on disk tells us how 0.351 was originally
computed, so we cannot say whether the old number was wrong, was right under a definition we
have not thought of, or was computed over a different population — only that we cannot get it
back. The script and CSV we publish are therefore the authority for this metric in the strong
sense that they are the only authority: the metric has been computed once, by us, and
checked against nothing external. And the definitional spread is not small next to the effect
— across the three alternatives we tried alongside the published definition the mean moves
between 0.3294 (without whitespace stripping), 0.3680 (keeping blank lines) and
0.3479 (with de-duplication) — a span of about 11% of the figure —
and that is four variants in all, tried rather than enumerated — so the point estimate 0.3484
should be read as definition-dependent. The gap between the resolved and unresolved
populations survived all four variants, and that is the claim we actually make. The variant means,
and the mixed-definition diagnosis that explains where 0.3484 came from, are in
memorisation_check.md.
The definition is sensitive, so here it is in full. Added lines are the + lines of a
patch, excluding the +++ file headers, whitespace-stripped, with blank lines dropped. The
gold patch's added lines are taken as they appear, not de-duplicated. Recall is the
fraction of those gold added lines that also appear among the model patch's added lines. Gold
comes from the cached SWE-bench/SWE-bench_Lite test split; the model patches are arm A's
prediction files. That whitespace strip is not cosmetic: without it the mean moves from 0.3484
to 0.3294 and the median from 0.1667 to 0.0909. A memorisation number quoted without its
definition is not a number.
- Median 0.1667, mean 0.3484.
- 32 of 135 resolved instances reproduce the gold patch exactly — but 22 of those have a one-line gold patch, where any correct fix is necessarily identical.
- The control is all 88 scorable unresolved-but-patched instances (88 scorable of 89) — cases where the agent wrote a patch that did not pass. It scores mean 0.0995, i.e. 3.50x lower than the resolved set, median 0.000, maximum 0.556; not one reaches 0.7. The metric discriminates; it is not just measuring "looks like Python".
- The control was originally recorded as a 30-instance sample, and that sample cannot be recovered: no script, no seed and no id list for it survive, so we do not report it and no claim here rests on it. It is the "subset that turned out not to exist" in the list of five above; the 88 scorable instances are a recomputation, not that sample.
- One instance is unscorable and is excluded from both populations rather than counted as
zero:
pytest-dev__pytest-5413, whose gold patch adds no non-blank line, so the recall denominator is empty. It is an unresolved-but-patched instance, which is why the control is 88 scorable of 89.
The strongest single suspect, and what we can and cannot show
sphinx-doc__sphinx-8713 is the one instance where the match is total: the model's added block is
byte-identical to gold, 7 of 7 lines, same order, same indentation, same else:
branching, same multiple=True. Both patches touch only sphinx/ext/napoleon/docstring.py,
at the same hunk. Recall 1.000. The comment really is among those seven lines, reproduced
verbatim. If any instance in this run looks like recall of the benchmark, it is this one.
It has an ordinary explanation, and on re-inspection the explanation is recorded rather than
asserted — and the re-inspection also cut two of our own claims down. The sibling method
_parse_parameters_section sits 2 lines below the edit site (the edit replaces one line;
the sibling's def is two lines further down). The file at the task's base commit
3ed7590ed411bd93b26098faab4f23619cdb2267, read from the public sphinx repository, contains
that sibling with a body character-identical to the seven added lines except for one token — _('Parameters') where the fix needs
_('Other Parameters'). The fix is that sibling's body, applied to the method next to it.
The split that matters is between what the task description already handed over and what
only the file could supply. Setting the seven added lines against the issue text line by
line: the issue handed the model the shape — 4 of the 7 lines appear in it verbatim, and so
does the whole control-flow shape of the fix, because the issue author pasted both methods
into the bug report. The file supplied the comment and the argument. Those two, and only
those two, are absent from the prompt: substring search over everything the model was
given before its first step finds multiple=True 0 times and Allow to declare 0 times in
both. So a model could assemble most of this block from the issue alone; the verbatim comment
and multiple=True are what the file accounts for.
The file at that base commit, in the public sphinx repository, has the two methods adjacent, with the sibling carrying that exact comment. That is a read anyone can repeat.
Four notes travel with this receipt, stated at full width rather than left for a reader to find. Three are limits; the first was a limit until we checked it.
- Line numbers: attested by the header, then confirmed against the file. The hunk header
@@ -682,7directly attests the pre-edit region 682–688; that is where the edit site (685) and the sibling'sdef(687) are read off. The sibling's body at 688–694 was at first only inferred from the body being seven lines long. It is no longer inferred: the file at this instance's base commit3ed7590ed411bd93b26098faab4f23619cdb2267was read from the public sphinx repository, and lines 688–694 are that body, byte-for-byte as quoted. The span is attested, and a reader can repeat the check from the commit alone. - No specific pre-edit read exists in the record. The run record does not preserve a pre-edit read of the file, so no specific read can be pointed to. What is established is a property of the source tree — the sibling existed in the file, adjacent to the edit site, carrying the identical comment — not a property of any one read. That is the honest form of the claim, and it is enough to carry the conclusion here.
- The issue supplied the shape, so the file accounts for less than the headline suggests.
The issue author pasted both methods into the bug report, so the issue itself supplied 4 of
the 7 lines and the whole control flow of the fix, and the file's contribution reduces to
two elements: the comment and
multiple=True. Those two are demonstrably absent from the prompt — 0 substring hits each, across everything the model was given before its first step. What we have, then, is: the model needed the file for two tokens' worth of content, the file next to the edit site contained exactly those, and we can show the file contained them without being able to show the model read them. That is a plausible account, not a proof. - One instance of 32. This explains
sphinx-doc__sphinx-8713and says nothing whatever about the other 31 exact reproductions, none of which has been inspected this way. We chose this instance because it was the most suspicious one, not because it was representative, and an explanation that clears the hardest case does not clear the other 31 by implication: the remaining 31 are simply unexamined. Whether the same innocent explanation covers them is open, and nothing in this post should be read as evidence that it does.
We publish the methodology and the full numbers, not the conclusion alone.
Where the losses actually are
In the baseline arm, of 165 failures, 76 produced no patch at all — 40 hit the configured
limits, 35 were locked in a repeating loop, 1 (pylint-dev__pylint-5859) exited Submitted
with an empty patch. A quarter of the benchmark was lost
to the agent repeating itself or running out of budget, before any question of whether it
could write the right fix.
That is the loss the best arm attacks.
Timing anatomy
Computed over all 300 arm-A trajectory files — one per pre-registered instance, every one of them carrying its run metrics. There is no subset here and no discarded tail.
- Wall clock per task: mean 264.2 s, median 176.6 s, 79,270 s in total. Both are quoted because the gap between them is the finding: the distribution has a long right tail, and a mean alone would describe a typical task that does not exist.
- The LLM is 95.4% of the wall clock in aggregate (75,645 of 79,270 s), and the per-task median is 95.5%. Almost nothing is the harness.
- Prefill median 37.9 s, decode median 123.8 s.
- Model calls: mean 56.9, median 44.0. This is the agent's step count — the number of model calls it actually spent. A different per-task quantity also exists in the records; we quote the step count, and we say which one we quote because the two are both defensible and are not the same quantity.
- Completion tokens: mean 11,107, median 7,092, over all 300 tasks. An earlier internal
note gave ~7,166, which is close to the mean over the 225 tasks that ended in
Submitted(7,179) — a different population. The all-300 figures are the ones above.
The whole of this section was remeasured at n = 300 rather than carried over. It replaces an earlier internal set of figures — ~290 s wall per task, ~85% LLM share of wall, prefill/decode medians of 40 s and 125 s, and ~54 model calls — every one of which is superseded by the numbers above.
On this hardware the bottleneck is not the harness. It is the model, and within the model it is decode.
Serving throughput, and a correction to an earlier draft
Measured on this hardware, concurrency trades per-stream speed for aggregate throughput, and
the return on extra streams is much smaller than an earlier internal draft of this post stated. The figures below
are sustained medians over the real agent workload, on the same model and server build the
arms used (Qwen3.6-35B-A3B-UD-Q4_K_XL, four slots, 16384 tokens of context per slot), and
they rest on up to 159,000 decode samples. That sample count is a count of decode
observations, not of independent trials: every one of them comes from the same single log of
the same single run on the same single machine, so a large n here buys precision within that
run and buys nothing at all against run-to-run variation, which we did not measure.
| Concurrent streams | Per-stream decode, sustained median (tok/s) | samples |
|---|---|---|
| 1 | 57.6 | 3,139 |
| 2 | 21.9 (shape only) | 1,736 |
| 3 | 18.9 (shape only) | 22,093 |
| 4 | 17.1 | 159,169 |
Read the 2- and 3-stream rows as shape, not as figures of the same standing as the 1- and 4-stream ones. Under real agent scheduling the server sits at four slots almost all the time; two and three active slots are transients during ramp-up and drain, and the samples are correspondingly thin — 1,736 for the 2-stream bucket against 159,169 for the 4-stream one, a disparity of roughly ninety to one. The 2-stream bucket is also the only one where the three estimators disagree by more than 10% (21.90 / 21.98 against a token-weighted 19.76). Our own receipt says it would not publish 21.9 as a 2-stream figure at all; we keep it, labelled, as the shape of the curve. 17.1 at four streams is the reliable number here.
"Shape only" is meant at full strength. We are not claiming 21.9 and 18.9 as measurements of what this server delivers at two and three concurrent streams; we claim only that the curve falls between the one-stream and four-stream rows, and even that rests on the two rows we do trust. Both transient rows are contaminated by ramp-up and drain in a way we cannot separate out: a slot that has launched but is still prefilling counts as active while decoding nothing, and that mislabelling is concentrated in exactly the moments when the slot count is two or three. The 3-stream row's 22,093 samples look reassuring next to the 2-stream row's 1,736, but they are drawn from the same transients, and we did not check the three estimators against each other for that row at all — its apparent agreement is untested, not confirmed. Anyone needing real 2- and 3-stream figures has to run the server at two and three slots on purpose. We did not.
Aggregate throughput at the four-slot serving configuration the arms ran under is 65 to 71 tok/s, and total scaling against a single stream is 1.15x to 1.31x. Both are published as ranges on purpose. They also rest on one log, one run, one machine, never repeated: no independent replication exists for any of the sustained figures. Four estimators were run over the same log: 68.5 tok/s (sum of per-stream medians of the instantaneous decode rate), 70.6 (sum of per-task medians with prompt eval excluded), 64.9 (token-weighted per-task), and a fourth built from wall clock and counted decoded tokens, multiplying nothing, which gives a lower bound of 55.4 and the highest ratio, 1.31x. The 65-to-71 range does not contain all four estimators, and we would rather say so than let the range imply it does. The wall-clock estimator — the only one of the four that multiplies nothing and is therefore the least structurally suspect — sits at 55.4, below the published floor, because it charges the idle and prefill time between decode bursts against the same wall clock. We publish 65-71 as the decode-throughput range under the named configuration and 55.4 as a wall-clock lower bound on the same run, and we do not claim the two are measuring the same quantity; a reader who wants the more conservative figure should take 55.4.
The weakest point in our own replacement, stated rather than buried. Our concurrency tracker counts a slot that has launched but is still prefilling as active while it decodes nothing, which biases the per-stream median downward by an amount we cannot separate from the genuine prefill contention that probably explains the probe-versus-sustained gap in the first place. And the construction that made the old 103.2 misleading — a sum of medians — is not confined to the one number we named: two of the three estimators inside the 65-71 range — 68.5 and 70.6 — are sums of per-stream or per-task medians, so the published floor and ceiling are not independent of each other or of the defect. A sum of medians is not the median of a sum, and the two share the bias rather than bracketing it. We have not quantified how large that bias is. We know its sign is unclear — the active-slot mislabelling pushes the per-stream median down, the sum-of-medians construction pushes the aggregate up — and we cannot net them against each other with what we recorded. A single headline number would inherit all of that silently. The range is the honest form available to us; it is not a confidence interval, and it should not be read as one.
Correction to an earlier draft of this post — and it is narrower than we first said. That
draft, never published, carried a cleaner staircase: 59.2 / 41.2 / 31.8 / 25.8 per stream, aggregates
82.35 / 95.32 / 103.12, headline 1.74x. Nobody invented any of that. Those four per-stream
figures come from a ramp in the first hundred lines of the server log that steps cleanly
through one, two, three and four slots, each step a 31-token prompt generating exactly 300
tokens. That is the shape of a deliberate capacity probe, though no script or note documents
it as one, so calling it deliberate is our inference from the log's shape. The four figures
reproduce that draft's column exactly. Nor was the aggregate arithmetic standing in for a
measurement: at the four-slot step all four slots ran identical work and released within
0.4 ms of each other, so 103.45 tok/s was genuinely delivered. The defect is the label,
not the arithmetic. 103.2 is a true statement about a 300-token warm-up probe and a false
statement about the machine under an agent workload, and that draft stated it as the second. The
probe's prompt is 31 tokens; real traffic on this server carries prompts of thousands, so
under load the slots spend much of each cycle in prompt eval, contributing no decoded tokens
and stealing compute from the slots that are decoding. That is the gap. The log lines behind
each step, and the arithmetic behind 103.45, are in receipt_staircase.md.
The correction inherits the limits of the thing it corrects. The ramp appears once, in the first hundred lines of one server log; the four figures are four single steps, not four distributions, and 103.45 is recomputed from that same log rather than from an independent run. So the explanation we are offering for the gap — prompt eval under long real prompts — is consistent with the evidence and is not demonstrated by it: we did not run the probe again at a realistic prompt length to confirm that prefill is what closes the gap.
The caveat that mattered before still matters: this is a measurement of serving throughput under this configuration, not a measure of how much work an agent gets done per second. Each number above names the configuration it came from — four slots, 16384 context per slot, the arms' own model and server build.
What the field can use
- Run the whole split, and fix the denominator in writing. Partial splits with a favourable denominator are the default failure mode of agent benchmarking. 300 out of 300, with a hashed manifest and a denominator that cannot move, costs nothing but honesty.
- Write the bar down first, and make elimination arithmetic. Resolved plus ungraded below the bar ends an arm without a debate.
- Declare your confounds before you run, not after. Ours was concurrency, it was declared in advance with a tripwire, and the tripwire fired on five tasks. That is only reportable because it was written down first.
- Grade one instance per run. Our bulk-graded arm is the one we cannot fully trust, and the causes were three unbuildable environment images and repositories whose own install step fails.
- Run a negative control and a memorisation check, and publish their methodology, not just their reassuring output.
- Measure the failures, not only the wins. Our largest single loss category — a quarter of the benchmark — was not "wrong patch"; it was "no patch, agent stuck". Those two failures have nothing in common and do not have the same fix.
We are not releasing the agent. What we are releasing is the task manifest, the pre-registration, the per-arm counts, the grading protocol, arm A's negative control and the memorisation check, and a README that leads with the defect above.
Receipts: https://github.com/SynenergyAI/swebench-lite-300-receipts (CC BY 4.0).